
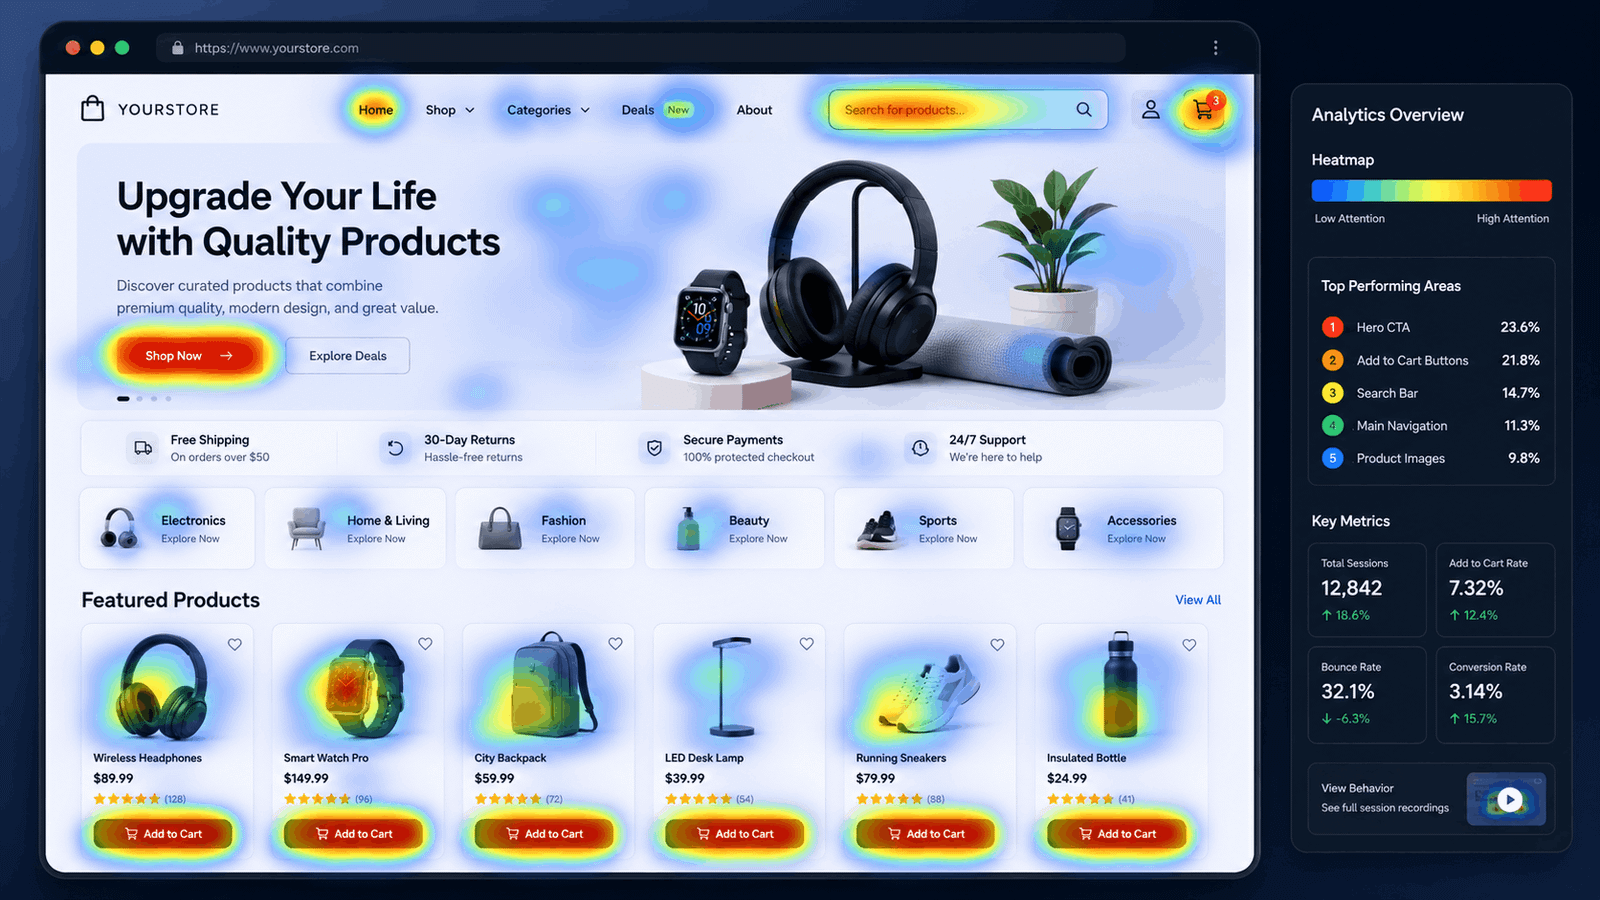
You see traffic but not enough sales. Visitors land on product pages, scroll a little, then bounce. No purchase, no add to cart, no sign of intent. Before you rewrite copy or redesign the layout, you need to know exactly where they stop, click, or rage-exit. That is where Shopify heatmap analytics come in.
Heatmaps turn anonymous visitor behavior into visual patterns. They show what elements get attention, what gets ignored, and which areas people repeatedly poke even though they are not clickable. This guide walks you through setting up heatmaps on Shopify, interpreting click, scroll, and move data, then turning that intel into revenue moves, including better structured data, faster product media, and sharper content. No fluff, just operator tactics.
What Shopify Heatmap Analytics Actually Tell You
Heatmaps compress thousands of sessions into a single color-coded view. A red spot means intense activity; blue means nobody goes there. There are three main types you need on your store: click maps, scroll maps, and move maps. Click maps reveal dead clicks, clicks on non-interactive elements, and true button engagement. Scroll maps show how far down the page users go before losing interest; they flag whether critical content like reviews, shipping info, or pricing sits below the average fold. Move maps track mouse movement (a decent proxy for eye-tracking) and highlight where attention lingers on a product image, a headline, or a testimonial block.
For a Shopify merchant, the most valuable insight is often a dead zone on the product page right where you placed your main value proposition or where users repeatedly try to click an image that does not lead anywhere. Heatmaps also expose distraction: a coupon-code field that steals clicks away from the add-to-cart button, for instance. The Baymard Institute's ecommerce UX research repeatedly shows that unclear next steps and non-clickable elements are among the top causes of cart abandonment. Heatmaps make those invisible UX issues glaringly obvious.
- Click maps: identify real vs. dead clicks on buttons, images, and links
- Scroll maps: check if users ever see your social proof or shipping guarantees
- Move maps: approximate where visitors look, especially on image-heavy PDPs
For broader context, review Baymard Institute's ecommerce UX research.
Where to Place Heatmap Tracking on Shopify (Priority Pages)
Not every page needs a heatmap. Focus on pages where buying intent is highest and where a small improvement in clarity lifts revenue. The four pages you should track first: product detail pages (PDPs), collection pages, the cart page, and the first step of checkout. If you run paid ads, also heatmap your dedicated landing pages. A heatmap on the PDP tells you if variant selectors cause confusion, whether image galleries get explored, and whether the add-to-cart button actually gets used. A checkout heatmap reveals if coupon-code fields distract, if trust badges get noticed, or if a shipping calculator blocks progress.
The fastest way to start is with a Shopify-native workspace that includes heatmaps alongside session replays. With Nimora, you paste one snippet into your theme or install directly from the Shopify App Store, and heatmap data starts collecting immediately across all the pages you select. No script conflicts, no third-party overload.
- PDP: variant buttons, image swipe zones, add-to-cart, accordion blocks
- Collection page: hover areas, quick-view clicks, filter bar engagement
- Cart: coupon field, trust badges, continue-shopping vs. checkout links
- Checkout (if allowed): form fields, discount code entry, express buttons
Useful next step: install directly from the Shopify App Store.
Reading Click Maps: The Clicks That Matter on Product Pages
Open a click map of your best-selling product. Look for hot spots beyond the obvious buttons. Are users clicking on the main product image? If the image is not linked to a zoom or gallery function, those are dead clicks and signal that visitors want to see more detail. Add a zoom-on-click or auto-play a product video. If the second or third image in the gallery gets heavy clicks, make sure alt text describes exactly what is shown; search engines also care about that. Too many clicks on a sizing chart link that opens a tiny pop-up? Create an inline size guide instead.
Now check the area around the add-to-cart button. Any competing hot spot nearby? A common leak: a color swatch row that draws so much click attention that buyers forget to hit 'add.' Use Nimora's visitor analytics to build a conversion funnel and see exactly at which point users drop off. Combine click maps with session replays: watch a few recordings where the same dead click appears, and you will instantly understand the intent behind it.
- Flag image dead clicks and add zoom, video, or 3D view
- If swatches steal focus, reduce visual weight or reposition
- Compare click maps to funnel drop-off points for pattern confirmation
Useful next step: Nimora's visitor analytics.
Scroll Maps: Is Your Key Content Below the Fold?
Scroll maps show color bands from red (top, fully seen) to blue (bottom, barely visible). If your product description, ingredient list, or shipping promise sits entirely in blue, almost nobody reads it. Move that content higher, or break it into a sticky accordion. In mobile-first Shopify stores, scroll depth is even more brutal. A long paragraph of specs after a string of lifestyle images often never gets viewed. Replace it with a short bullet list and a product reel that autoplays after the gallery.
When you find a scroll depth drop-off, check page speed at that point. Heavy unoptimized images can cause a rendering delay, making users think the page ended. Run Nimora's image speed scanner on your product pages; it spots oversized media that hurts load times. A faster page keeps users scrolling and reduces the chance they bounce before seeing your CTA.
- Redistribute content: move social proof, trust badges above 50% scroll
- Use product reels and AI-generated visual content to sustain attention
- Fix image payloads that cause mid-page rendering stalls
Useful next step: image speed scanner.
Turning Heatmap Findings into SEO Wins (Rich Snippets, Alt Text, Page Speed)
Heatmaps often signal opportunities that search engines reward. If click maps show heavy interaction with your product image gallery, make sure every image has descriptive alt text that includes relevant terms. If users scroll a long PDP and finally click the reviews tab, those stars should appear in search results via JSON-LD structured markup. Google Search Central confirms that rich snippets improve click-through rates from SERPs. When your listing shows price, availability, and star rating, it stands out in a sea of plain text links.
Generating valid JSON-LD for product pages does not require a developer. Nimora's structured data tool creates the markup for products, collections, articles, and more. Paste the snippet once, and Google recognizes your offer data. This combines with the UX fixes you made from heatmap data: better alt text, faster images, and clear content hierarchy. Together, they form a loop where better behavior signals on the page feed back into stronger search performance.
- Add JSON-LD product markup for price, availability, and review stars
- Use alt text on all images that appear in click-map hot zones
- Speed up images that sit above scroll drop-off points to keep users engaged
Useful next step: structured data tool.
For broader context, review Google Search Central.
Case Study: Fixing a Checkout Leak with Heatmaps and Session Replays
A Shopify store selling home office gear noticed a consistent drop between cart and checkout, even though the cart page looked clean. The click map showed a bright red zone on the 'Add a discount code' link, while the 'Checkout' button was lukewarm orange. Session replays confirmed visitors opened the discount field, typed random codes from coupon sites, hit error messages, and then abandoned. The fix: they removed the discount-code field at cart level and moved it to the first step of checkout, behind intent. Cart-to-checkout progression immediately lifted by 12%.
With a workspace like Nimora, you do not need to jump between a heatmap tool, a replay tool, and an SEO tool. Heatmaps, session replays, funnels, and SEO audits live in one place. That means you can spot a dead click in a heatmap, watch the replay, diagnose the funnel leak, and then generate a product reel or update alt text, all without switching subscriptions.
- Move coupon-code entry away from cart to reduce distraction
- Use session replays to confirm the intent behind abnormal click heat
- Measure impact in the same workspace: funnel analytics before/after fix
Useful next step: conversion funnels.
FAQs
What is the best heatmap tool for a Shopify store?
Look for a tool that combines heatmaps, session replays, and funnel analytics inside Shopify. That way you get a full picture without stitching together multiple apps. Nimora's workspace includes all three plus SEO and AI content tooling, so you can go from insight to fix quickly.
How can heatmaps improve Shopify SEO?
Heatmaps reveal how real visitors interact with your pages. You can spot images that need better alt text, content placed too low on the page, or UX friction that increases bounce rate. Fixing these signals improves user engagement metrics, which search engines factor in. Plus, you can use the data to prioritize structured data implementation on high-impact product pages.
Do I need to code to set up heatmap tracking on Shopify?
No. Most modern Shopify heatmap tools, including Nimora, work via a simple app installation or a one-time theme snippet. No developer is required. You select which pages to track, and data starts collecting immediately.
Turn this workflow into a repeatable growth system
Stop guessing where your visitors lose interest. Install Nimora free from the Shopify App Store and put heatmaps, session replays, SEO audits, and AI-powered content creation into one workspace. See the dead clicks, fix the friction, and turn more browsers into buyers.